Data Mining
 Data mining is the computational process of discovering patterns in large datasets involving methods at the intersection of artificial intelligence, machine learning, statistics and database systems (Rokach 2007). The overall goal of the data mining process is to extract information from a dataset and transform it into an understandable structure for future use.
Data mining has a number of different functionalities. In general, they can be grouped into two categories: descriptive and predictive. Descriptive data mining characterizes properties of the data in a target dataset. It usually includes characterization and discrimination, mining frequent patterns and associations, clustering analysis, and outlier analysis. Predictive data mining performs induction on the current data in order to make predictions, and usually refers to classification and regression (Han et al. 2011).
Data mining is the computational process of discovering patterns in large datasets involving methods at the intersection of artificial intelligence, machine learning, statistics and database systems (Rokach 2007). The overall goal of the data mining process is to extract information from a dataset and transform it into an understandable structure for future use.
Data mining has a number of different functionalities. In general, they can be grouped into two categories: descriptive and predictive. Descriptive data mining characterizes properties of the data in a target dataset. It usually includes characterization and discrimination, mining frequent patterns and associations, clustering analysis, and outlier analysis. Predictive data mining performs induction on the current data in order to make predictions, and usually refers to classification and regression (Han et al. 2011).
In this study, due to different purposes, we have utilized different functionalities of data mining in different ways. Specifically, association rule analysis, clustering analysis, classification and regression.
Association Rule Analysis
 Frequent patterns are those that occur frequently in transactional data (e.g. market basket data). Three kinds of frequent patterns are commonly mined: frequent itemsets, frequent subsequences, and frequent substructures (Han et al. 2011). A frequent itemset typically refers to a set of items that often appear together. For example, milk and bread, which are frequently bought together in stores by many customers. A frequent subsequence pattern is a sequential pattern. For example, people buy a smart phone before buying a phone case. A frequent substructure can refer to different structural forms (e.g., graphs or trees) that may be combined with itemsets or subsequences. If a substructure occurs frequently, it is called a (frequent) structured pattern. Mining frequent patterns leads to the discovery of interesting associations and correlations within data (Rokach 2007).
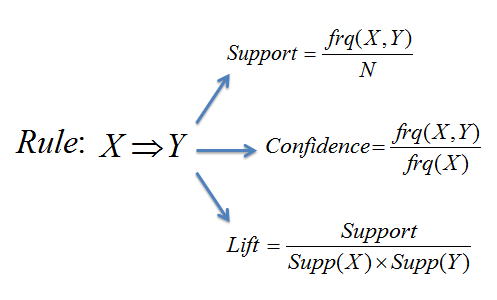
Association rules are more like an if/then statement which help uncover the relationships between the items or features in a relational database. For example, the rule {onions, potatoes} =>{burger} found in the sales data of a supermarket would indicate that if a customer buys onions and potatoes together, they will also likely buy hamburger meat. There are many kinds of measurements to evaluate the strength of a relationship between two items. Two of the most commonly used are support and confidence. Support reflects how frequently the items appear in the database, while confidence indicates the number of times the if/then statements have been found to be true.
Clustering Analysis
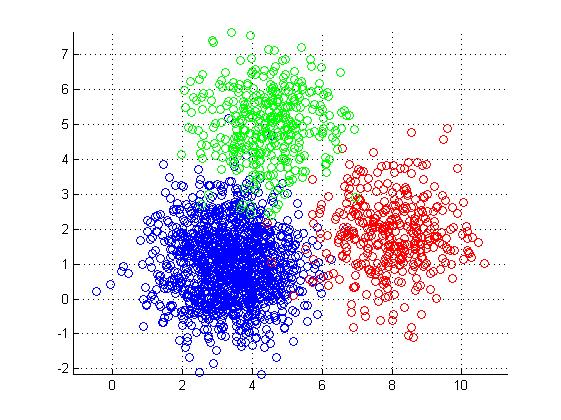 In general, clustering analysis is used to group data entries. The entries are clustered or grouped based on the principle of maximizing the intra-class similarity and minimizing the inter-class similarity (Han et al. 2011). That is, clusters of entries are formed so that objects within a cluster have high similarity in comparison to one another, but are rather dissimilar to entries in other clusters.
The appropriate clustering algorithm and parameter settings (including values such as the distance function, a density threshold or the number of expected clusters) depend on the individual dataset and intended use of the results. It will often be necessary to modify data preprocessing and model parameters until the result achieves the desired properties. Commonly used clustering methods include partitioning methods, hierarchical methods, grid-based methods, and density-based methods.
Classification and Regression
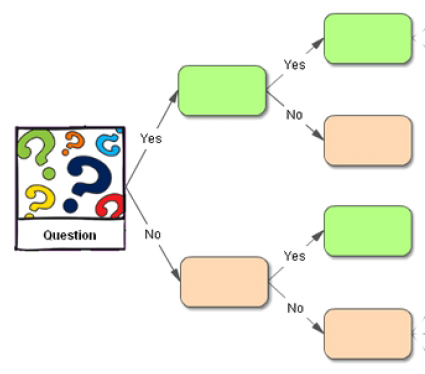 Predictive mining usually refers to classification and regression analysis. Classification is the process of finding a model (or function) that describes and distinguishes data classes or concepts. The models are derived based on the analysis of a set of training data (i.e., data objects for which the class labels are known). The model is used to predict the class label of objects for which the class label is unknown (Rokach 2007).
The derived model may be represented in various forms, such as classification rules (e.g., if-then rules), decision trees, mathematical formulae, or neural networks (Han et al. 2011). Different forms are trained or built by different algorithms or techniques, and details are introduced in later chapters. Commonly seen classification algorithms include Artificial Neural Networks, Support Vector Machines, Random Forests, etc.
The purpose of regression is similar to classification. The difference is classification predicts categorical (discrete, unordered) labels, while regression models continuous-valued functions. Commonly seen regression algorithms include Multiple Linear Regression, Support Vector Regression, Lasso, etc.